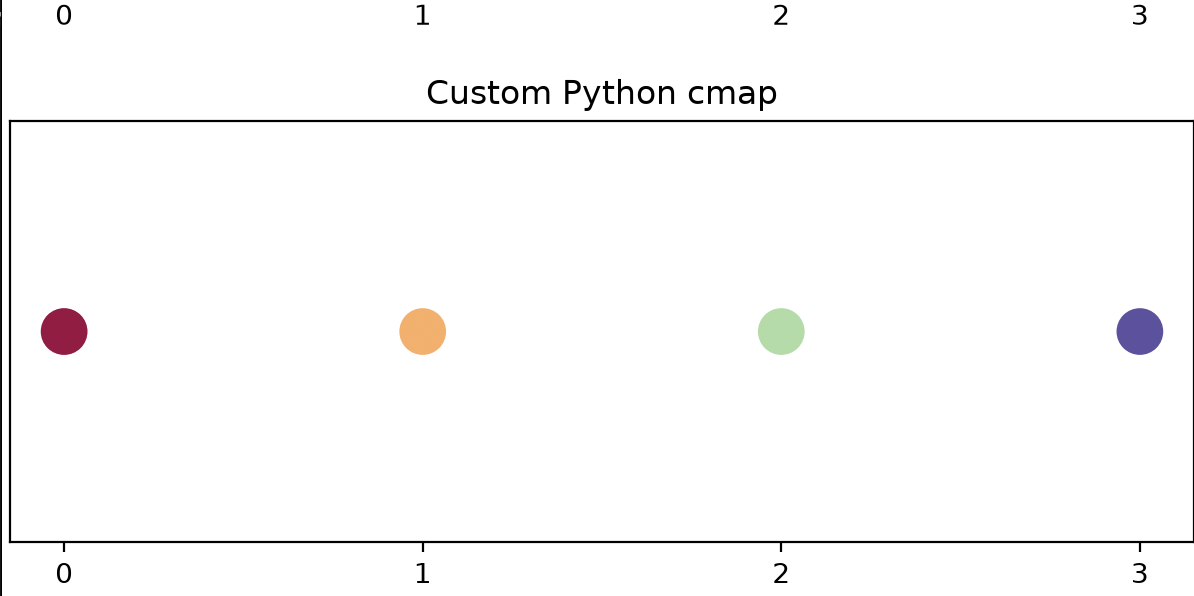
RGBA color scheme mapping and interpolation from input values.
Introduction
While following along a jupyter notebook assignment about planar data classification with one hidden layer, I came across an innocent looking image of a flower petal generated by below matplotlib code.
Code
  import matplotlib.pyplot as plt
  plt.scatter(X[0, :], X[1, :], c=Y, s=40, cmap=plt.cm.Spectral)
Generated Image
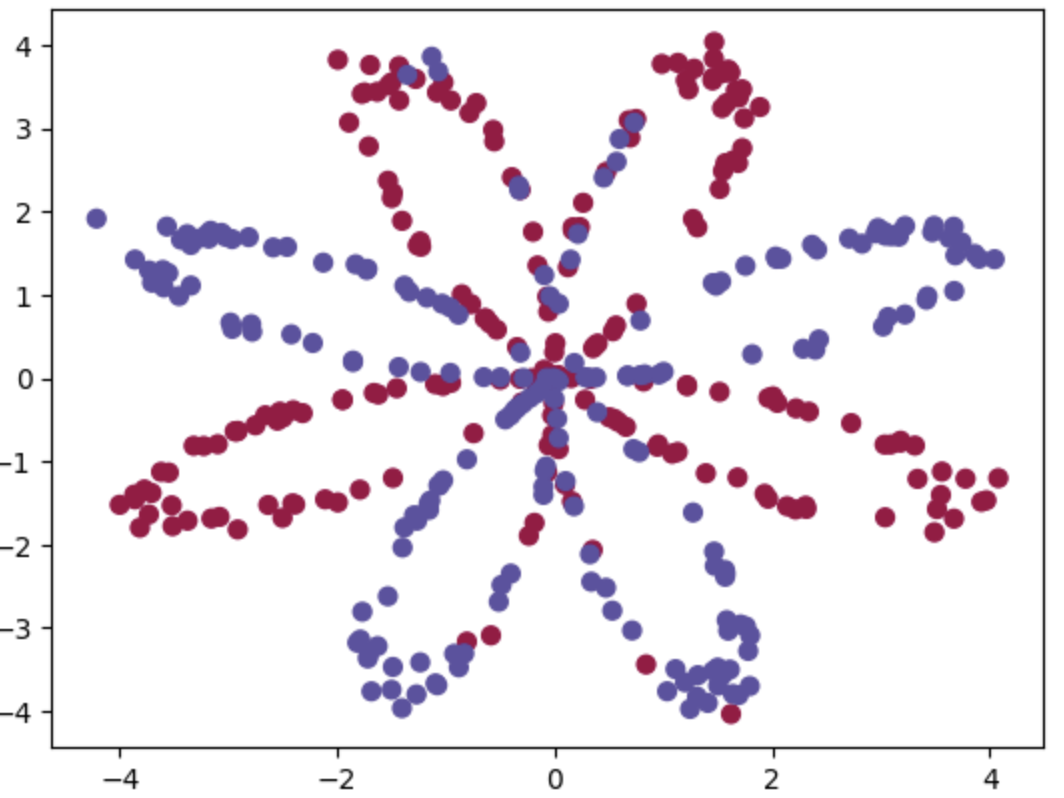
I was wondering how the colors are chosen from label classes (e.g. Y = 2) using the color palette which comes from cmap. The rest of the article is my attempt to understand it with the help of a custom implementation that is analogous to how it is implemented in matplotlib.
Custom Implementation
  #!/usr/bin/env -S uv run
  # /// script
  # dependencies = ["matplotlib", "numpy"]
  # ///

  """Standalone demo of a custom normalize + lerp + colormap mapping.

  Run:
      uv run color_interpolator_demo.py

  This script does two things:
  1. Builds RGBA colors from numeric values using a custom color interpolator.
  2. Plots those colors in a single scatter plot.
  """
  from __future__ import annotations

  import numpy as np
  import matplotlib.pyplot as plt

  class ColorInterpolator:
    def __init__(self, colors: list[tuple[int,int,int]]):
      self.colors = colors

    def normalize(self, x: float, vmin: float, vmax: float) -> float:
      """Map x into [0, 1]."""
      if vmax == vmin:
          return 0.0
      t = (x - vmin) / (vmax - vmin)
      return max(0.0, min(1.0, t))

    def lerp(self, a: float, b: float, t: float) -> float:
      """Linear interpolation between a and b."""
      return a + (b - a) * t

    def cmap(self, x: float, vmin: float, vmax: float) -> tuple[float, float, float, float]:
      """Map x to an RGBA tuple using a list of RGB anchor colors."""
      t = self.normalize(x, vmin, vmax)
      colors = self.colors
      n = len(colors)

      if n == 0:
          raise ValueError("colors must contain at least one RGB tuple")
      if n == 1:
          r, g, b = colors[0]
          return (r / 255.0, g / 255.0, b / 255.0, 1.0)

      pos = t * (n - 1)
      i = int(pos)

      if i >= n - 1:
          r, g, b = colors[-1]
          return (r / 255.0, g / 255.0, b / 255.0, 1.0)

      local_t = pos - i
      c1 = colors[i]
      c2 = colors[i + 1]

      r = self.lerp(c1[0], c2[0], local_t)
      g = self.lerp(c1[1], c2[1], local_t)
      b = self.lerp(c1[2], c2[2], local_t)

      # The "alpha" is always set to 1.0 which mean transparency is fully visible.
      return (r / 255.0, g / 255.0, b / 255.0, 1.0)

  def test_custom_cmap():
    # Custom color map similar to plt.cm.Spectral
    spectral_like = [
        (158, 1, 66),
        (213, 62, 79),
        (244, 109, 67),
        (253, 174, 97),
        (254, 224, 139),
        (230, 245, 152),
        (171, 221, 164),
        (102, 194, 165),
        (50, 136, 189),
        (94, 79, 162),
    ]

    # Here we have 4 classes
    values = np.array([0, 1, 2, 3], dtype=float)

    x = np.arange(len(values))
    y = np.ones_like(values)

    vmin = float(values.min())
    vmax = float(values.max())

    # Instantiation of our custom color interpolator
    color_interpolator = ColorInterpolator(spectral_like)

    # Custom colors retrieved using our custom color interpolator
    custom_colors = [color_interpolator.cmap(float(v), vmin, vmax) for v in values]

    # Rest of below lines are to setup matplotlib to display the plot
    fig, ax = plt.subplots(figsize=(6, 3), constrained_layout=True)
    ax.scatter(x, y, c=custom_colors, s=250)
    ax.set_title("Custom Python cmap")
    ax.set_xticks(x)
    ax.set_yticks([])
    for xi, v in zip(x, values):
        ax.text(xi, 1.08, f"{v:.0f}", ha="center")
    plt.show()

  if __name__ == "__main__":
    test_custom_cmap()
Generated Image